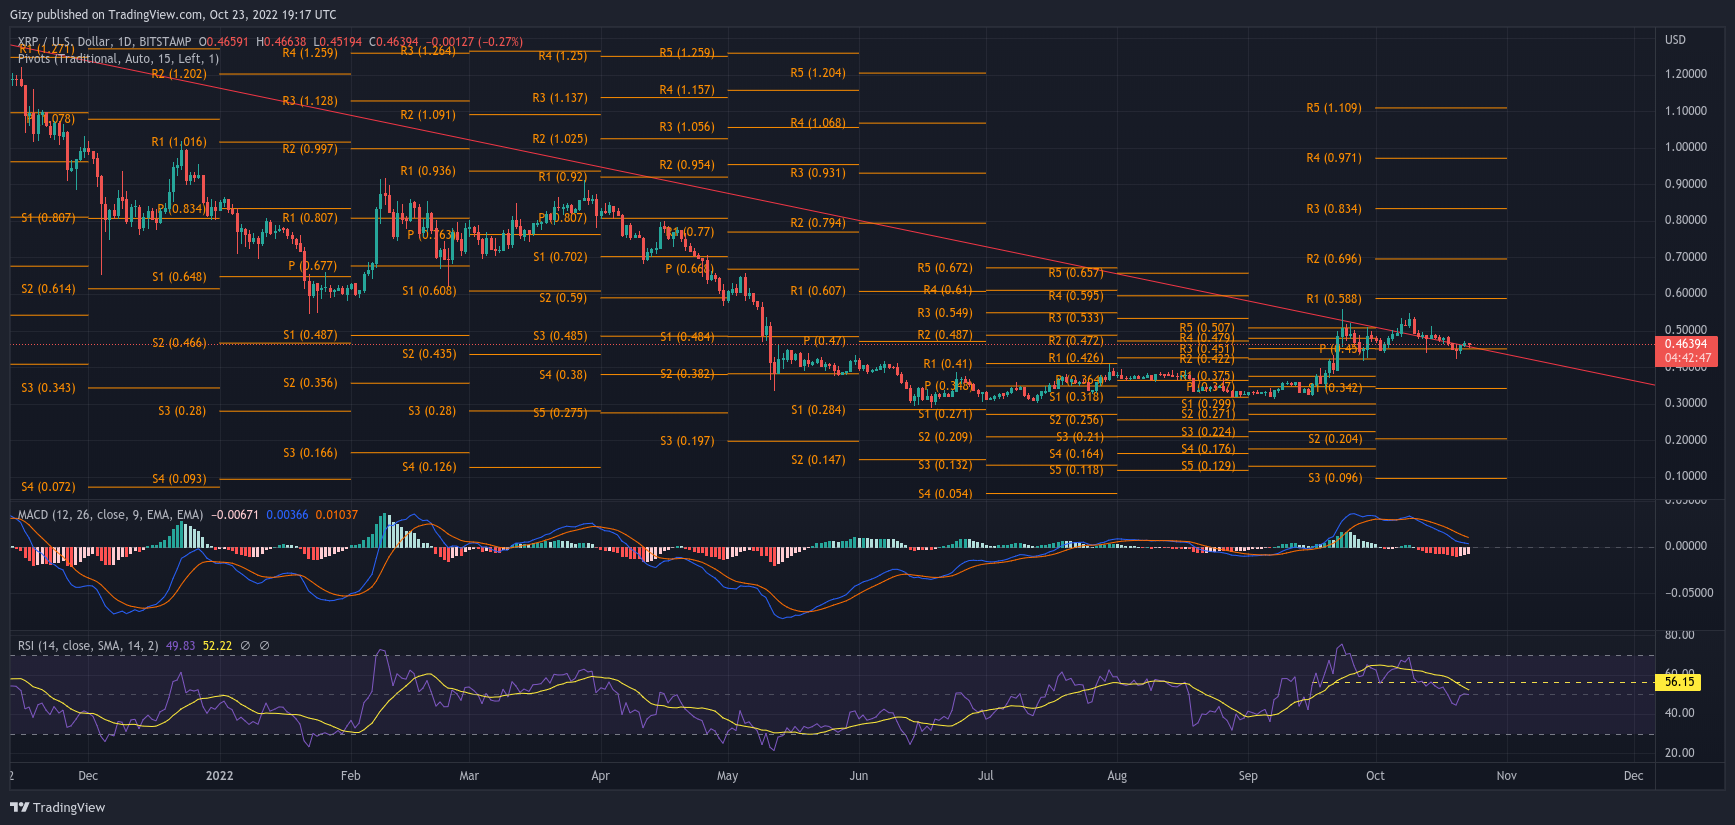
Ripple is one of the most talked about coin following it defying the current market sentiment. During its run, it surged by more than 18% in the first week of this month. One of the key levels it flipped includes $0.45, $0.48, $0.50, and $0.52.
It faced massive rejection at $0.54 after its attempt at the $0.55 resistance failed. Before this big change, we observed several build-ups last month. There were several small increases since the first week of September.
The biggest surge happened on the third week as the asset recorded gains of more than 37%. It opened at $0.35 but dipped to a low of $0.33. In response, the bulls rallied the coin to a peak at $0.55. The sudden spike was no surprise to Coinfomania, as a previous outlook predicted it. The analysis stated that XRP may retest and flip the $0.45.
At the start of the month, an analysis stated that the altcoin is set for a massive breakout. Price action over the last fourteen days proved this wrong. Nonetheless, it also warned that failure to gain stability above $0.55 will result in further downtrends.
Another bullish phenomenon is about to take place. What is it and how will it affect ripple?
A Golden Cross
The Moving Averages are the key components of this event. It happens when the 50-day MA intercepts the 200-day MA from below. Traditionally, it signifies the start a bull run and a notable change in trajectory.

A look at the chart shows that XRP just experienced this phenomenon. We observed a plus sign on the diagram above to indicate this. To understand the severity of this event, the last the asset had a death cross, massive downtrends followed.
It is currently down by more than 48%. It took place when the coin was at $0.85 and is exchanging at $0.46 at the time of writing. In February 2021, ripple had a golden cross. It was at $0.61 but peaked at $1.20.
The coin saw a more than 90% increase. Every positive cross is almost certain to guarantee positive changes in price. How high will XRP surge after the highlighted event? Let’s look at the indicators.
Ripple Still Bearish
Unfortunately, indicators are not playing out according to the bullish ambiance of the Golden Cross. For example, since its bearish divergence last week, the asset is yet to recover. We noticed that both the 12-day EMA and the 26-day EMA are still on a downtrend.

The most recent reading places them both a little above 0. This may be an indication that XRP may experience more price decreases. The Relative Strength Index is another source of concern. It is currently at 49.
The Pivot Point Standard holds little good news. Firstly, the coin is trading above its pivot point. The trend indicator is hinting at massive demand concentration at $0.45. This may be where the current comes to an end.
Failure to hold this key level may halt the impending uptrend. The first pivot support is at $0.34. Nonetheless, the histogram associated with MACD depicts the gradual decrease in selling pressure. Let’s see how prices play out in the coming days. Here are the vital levels to watch.
Key Levels to Watch
Vital Support: $0.42, $0.32, $0.30
Vital Resistance: $0.55, $0.65, $0.80

Following the bearish state of most indicators, the asset under consideration may see more downtrends. In recent times, the $0.45 barrier served a key role in halting price decreases. However, it broke twice in the last seven days.
Ripple is currently exchanging above it. Nonetheless, there is an indication that prices may sink lower. If that happens, the $0.42 support is one of the toughest. The level has held out since September 28.
Failure to defend this mark may send the coin as low as $0.32. The barrier remained intact since July and has come under several tests before the most recent surge. If it breaks, the next level to bank on is the $0.30.
It is the oldest in the list and the toughest as massive retracements always seem to halt there. On the flip side, ripple faced stiff rejection at $0.55. The latest attempt at the mark resulted in a brief flip.
Massive downtrends followed. Traditionally, most tough resistance performs well as a vital support. A flip of this key level will provide a strong positive barrier for the asset. This may guarantee a steady rise and break the $0.60 resistance.
The next level to watch after the highlighted mark is the $0.65 barrier. Like $0.55, failure to gain notable stability above $0.65 will result in another massive correction. The biggest and toughest on the list is the $0.80 resistance.
- Bitcoin Falls to $65K as Mt. Gox Transfers $2.8 Billion BTC to External Wallet
- News of Marathon Digital’s $138 Million Fine for Breach of Non-Disclosure Agreement Triggers a Bearish 2.5% of Its MARA Stock
- Are $530M Bitcoin ETF Inflows a Blessing or Caution?
- Metaplanet Teams with Hoseki for Real-Time Bitcoin Holdings Verification
- 10 Best Meme Coins To Invest in 2024
- Building Secure Blockchain Systems: An Exclusive Interview with ARPA and Bella Protocol CEO Felix Xu
- Building The “De-Facto Crypto Trading Terminal”: An Exclusive Interview with Aurox CEO Giorgi Khazaradze
- Building a New Global Financial System: An Exclusive Interview With Tyler Wallace, Analytics Head at TrustToken
- “Solana is the Promised Land for Blockchain” — An Exclusive Interview with Solend Founder Rooter
- El Salvador: Where The Bitcoin Revolution Begins With A Legal Tender

 Why Trust Us


