Bitcoin Price Surge Ahead? $65K Call Options Signal Bitcoin Rebound
 Why Trust UsAt Coinfomania, we prioritize accuracy, transparency, and reliability. Our expert team consistently provides the most recent cryptocurrency news and developments. All information is thoroughly researched and unbiased, ensuring you make informed decisions. Trust us for comprehensive and well-analyzed crypto news, guides, and insights.
The market for Bitcoin options is exhibiting signs of optimism. Investors have acquired large holdings and expressed interest in buying $65,000 call options that expire in May.
This move, worth 258.2 BTC, shows that there is considerable support for the idea that the price of the most prevalent cryptocurrency might rise. Lin Chen, Head of Asia-Pacific Business at Deribit, has pointed out this transaction, suggesting a possible market rebound by the end of the month.
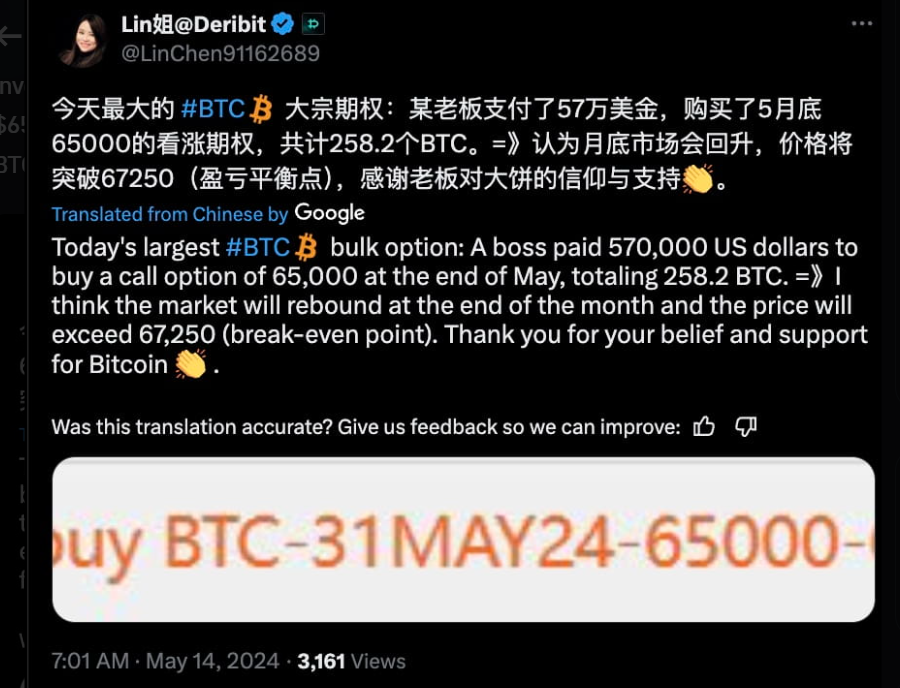
Source: Lin Chen on X
A substantial purchase of $65,000 call options expiring in May indicates an optimistic outlook for the Bitcoin options market from investor activity. This positive outlook is consistent with the expectation of a market recovery, as demonstrated by Deribit’s Lin Chen. The investor’s faith in the rising direction of Bitcoin highlights a growing sense of optimism despite recent market volatility.
Insights from Market Analysts and Derivative Platforms
Moreover, recent options data from Binance indicates an accumulation of open interest in Bitcoin options with a strike price of $75,000 for the June expiry, as highlighted by market analyst Ruslan Lienkha. Lienkha notes that this concentration of open interest coincides with Bitcoin’s previous all-time high, which reached mid-March when its value surpassed $73,000.
Options, derivative contracts that grant traders the right to buy or sell an underlying asset at a predetermined price by a specified date, play a pivotal role in market dynamics. Call options afford the right to buy, while put options offer the right to sell. Generally, call option buyers are bullish on the market, while put buyers adopt a bearish stance.
Despite anticipation of a potential price surge, Lienkha anticipates Bitcoin’s price will consolidate around current levels in the near future. This projection suggests a forthcoming phase of relatively stable trading, indicating a period of consolidation in the short term.
Mixed Signals in Technical Analysis Reflect Market Uncertainty
Despite the bullish sentiment in the options market, technical indicators suggest a neutral stance for Bitcoin’s price movement. The Relative Strength Index (RSI) on both the 4-hour and daily charts hovers around the midpoint, indicating neither overbought nor oversold conditions. Similarly, the Bitcoin KST indicator reflects a neutral trend, suggesting a lack of clear direction in the near term.
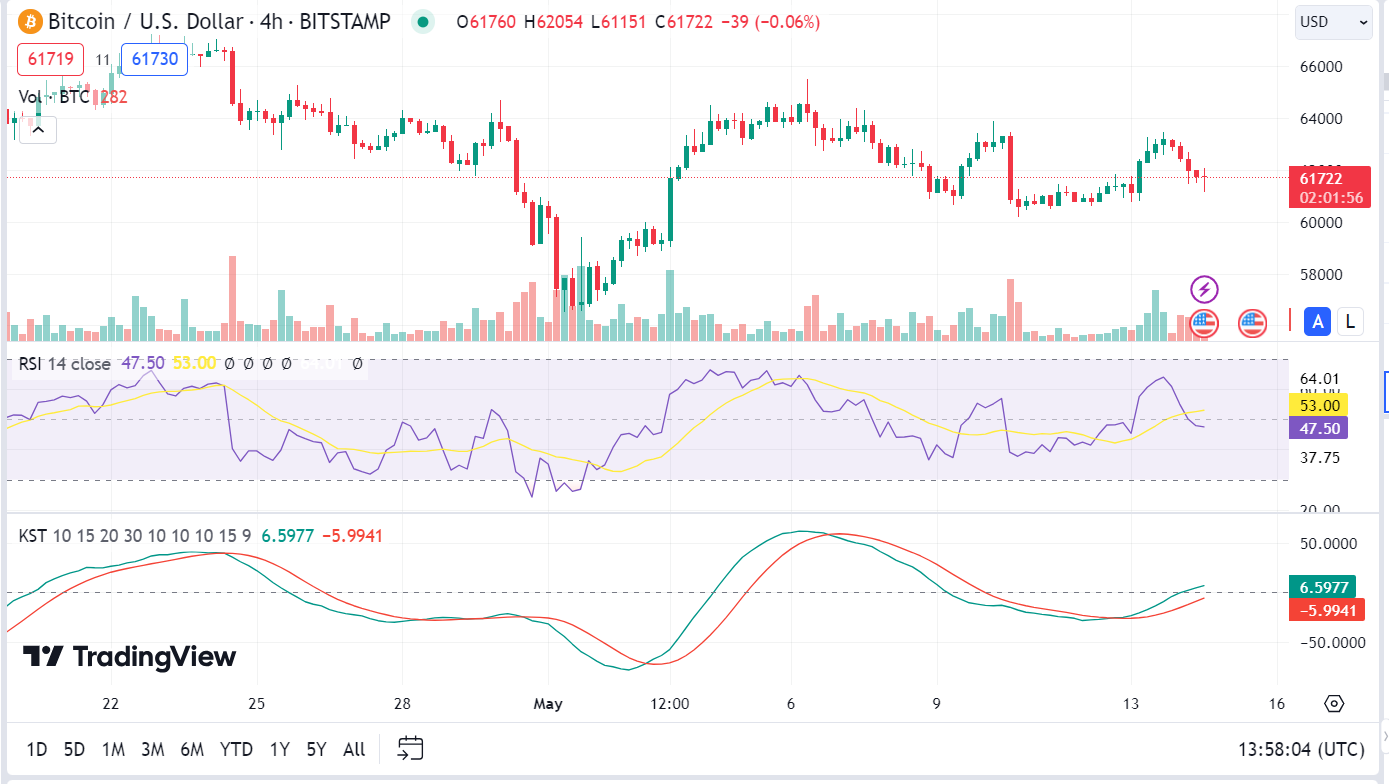
BTC/USD price chart (Source: TradingView)
Technical analysis of Bitcoin’s price charts presents a mixed outlook, with conflicting signals adding to market uncertainty. While Quinten Francois spots an inverse head-and-shoulders pattern, suggesting a potential price recovery, indicators such as the Moving Average Convergence Divergence (MACD) signal a strong bearish trend.
- Crypto Price Update July 24: BTC Maintains $66K, ETH at $3.4K, XRP, TON, and ADA Rallies
- Bitcoin Falls to $65K as Mt. Gox Transfers $2.8 Billion BTC to External Wallet
- News of Marathon Digital’s $138 Million Fine for Breach of Non-Disclosure Agreement Triggers a Bearish 2.5% of Its MARA Stock
- Are $530M Bitcoin ETF Inflows a Blessing or Caution?
- Metaplanet Teams with Hoseki for Real-Time Bitcoin Holdings Verification
- Building Secure Blockchain Systems: An Exclusive Interview with ARPA and Bella Protocol CEO Felix Xu
- Building The “De-Facto Crypto Trading Terminal”: An Exclusive Interview with Aurox CEO Giorgi Khazaradze
- Building a New Global Financial System: An Exclusive Interview With Tyler Wallace, Analytics Head at TrustToken
- “Solana is the Promised Land for Blockchain” — An Exclusive Interview with Solend Founder Rooter
- El Salvador: Where The Bitcoin Revolution Begins With A Legal Tender
Victor Muriki


Victor Muriki is an esteemed writer focused on cryptocurrency and finance, holding a Bachelor's in Actuarial Science. Known for his sharp analysis and insightful content, he has a strong command of English and is skilled at conducting in-depth research and ensuring timely delivery.
Related Posts

Feb 04, 2021
PayPal Records Massive Growth In Q4 2020 Fueled by its Cryptocurrency Offerings


Apr 18, 2023
Eyeing 100x Returns in 2023? Don’t Miss out on Hedera (HBAR), Aptos (APT), and HedgeUP (HDUP)
sidebar